

As of May 27, 2016 at 4:00pm, 934,852 ballots have been mailed to registered voters throughout the county. 157,078 voters have voted (either by returning their ballot, or through early voting).
This equates to an overall voting rate of 16.8% among all ballots mailed.
Breaking down the ballots by party, total returns are comprised of 39.36% Republicans (6.71% above registration), 42.23% Democrats (6.17%% above registration), and 18.41% independent (12.87% below registration).

(Click to enlarge)
In addition, please see the graph below for a breakdown of ballot returns by party over the first several days (City of San Diego).
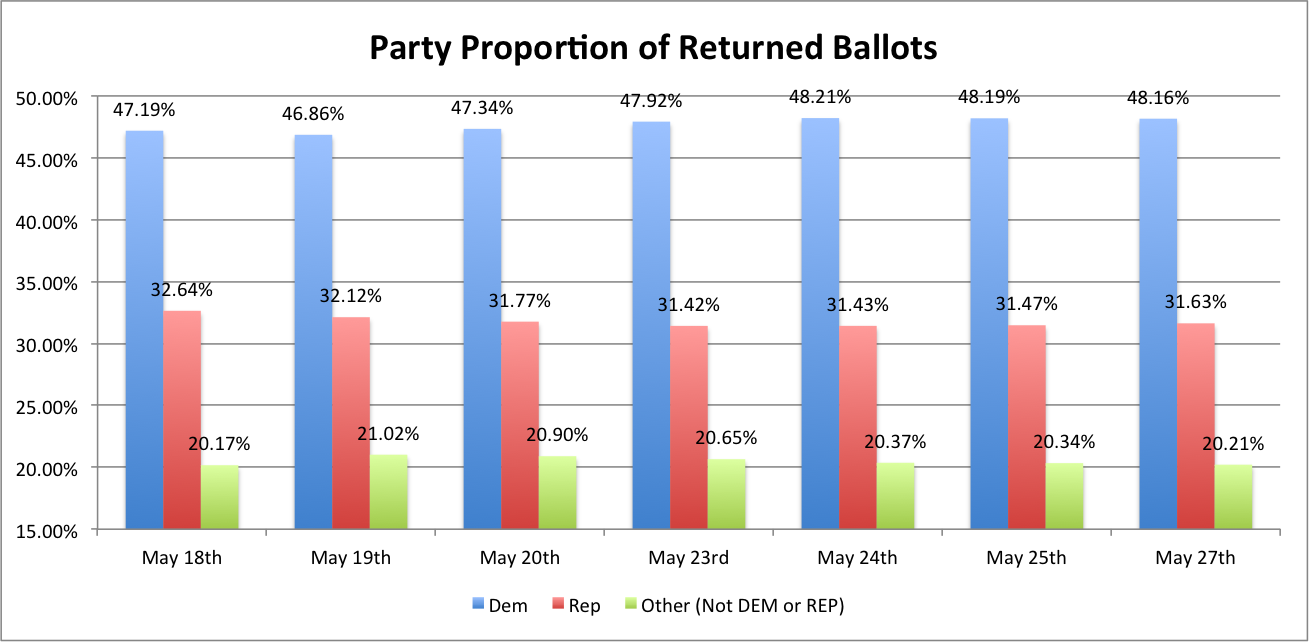
(Click to enlarge)
I have put together a more detailed demographic breakdown for various jurisdictions in this excel file. Each jurisdiction is its own worksheet within the file. The jurisdictions included are: Countywide, City of San Diego, San Diego City Council (Districts 1, 3, 5, 7, 9), Supervisor District 3, 52nd Congressional District, and Chula Vista City Council – District 4.
If you have questions on any of these breakdowns, or would like a breakdown on a specific jurisdiction not listed, please e-mail me at mpherron@gmail.com.
Note: These returns are based on data provided by the Registrar of Voters to Political Data Inc. Accordingly, there is likely a delay of at least 1-2 days relative to the actual number of ballots returned.
Comments 3
Thanks Mason. I get that only wonks understand the importance of the numbers. I appreciate your efforts!
Thanks for the info, poor turnout in an important primary. Voter apathy is pathetic.