

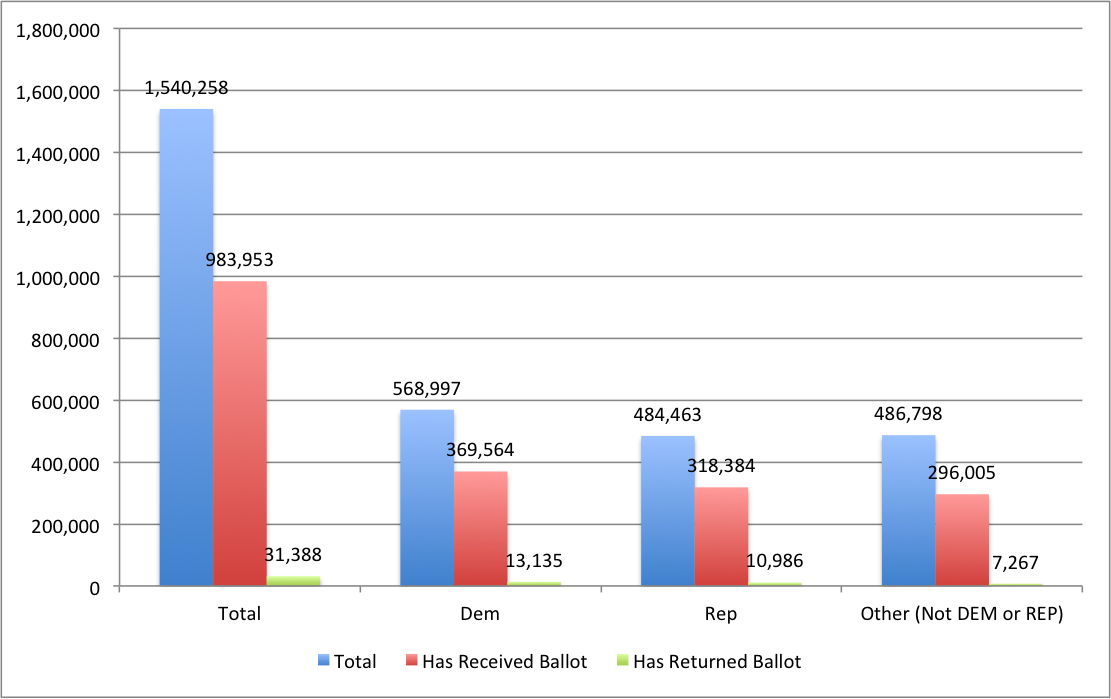
As of October 18, 2016 at 5:00pm, 983,953 ballots have been mailed to registered voters throughout the county. 31,388 voters have voted (either by returning their ballot, or through early voting).
This equates to an overall voting rate of 3.19% among all ballots mailed.
Breaking down the ballots by party, total returns are comprised of 35.00% Republicans (3.55% above registration), 41.85% Democrats (4.91% above registration), and 23.15% independent (8.45% below registration).
(Click to enlarge)
Here is an overview of how AV returns have come in, relative to registration. These are the final totals for these elections.
| 2014 General | 2012 General | 2010 General | |||||||
| Dem | Rep | Other | Dem | Rep | Other | Dem | Rep | Other | |
| AV Return | 36% | 42% | 23% | 36% | 40% | 28% | 35% | 44% | 22% |
| Registration | 35% | 33% | 33% | 35% | 34% | 31% | 35% | 36% | 29% |
| Difference | 1% | 9% | -10% | 1% | 6% | -3% | 0% | 8% | -7% |
Based on this data, it appears that Democrats are performing about 4% better than 2012, and Republicans 2-3% worse than 2012.
More in-depth breakdowns: County of San Diego, City of San Diego, Supervisor District 3.
If you have questions on any of these breakdowns, or would like a breakdown on a specific jurisdiction not listed, please e-mail me at mpherron@gmail.com.
Note: These returns are based on data provided by the Registrar of Voters to Political Data Inc. Accordingly, there is likely a delay of at least 1-2 days relative to the actual number of ballots returned.
Comments 1
This doesn’t look good.