

NOTE: These are very early (and small) data. I would not start reading too much into these until we have more ballots turned in. The initial wave of voters are uniquely motivated to vote, so may have a different demographic breakdown than the eventual aggregate numbers. Nonetheless, the data is posted, because it is there, and I know people are hopeful for any scraps you can get your hands on.
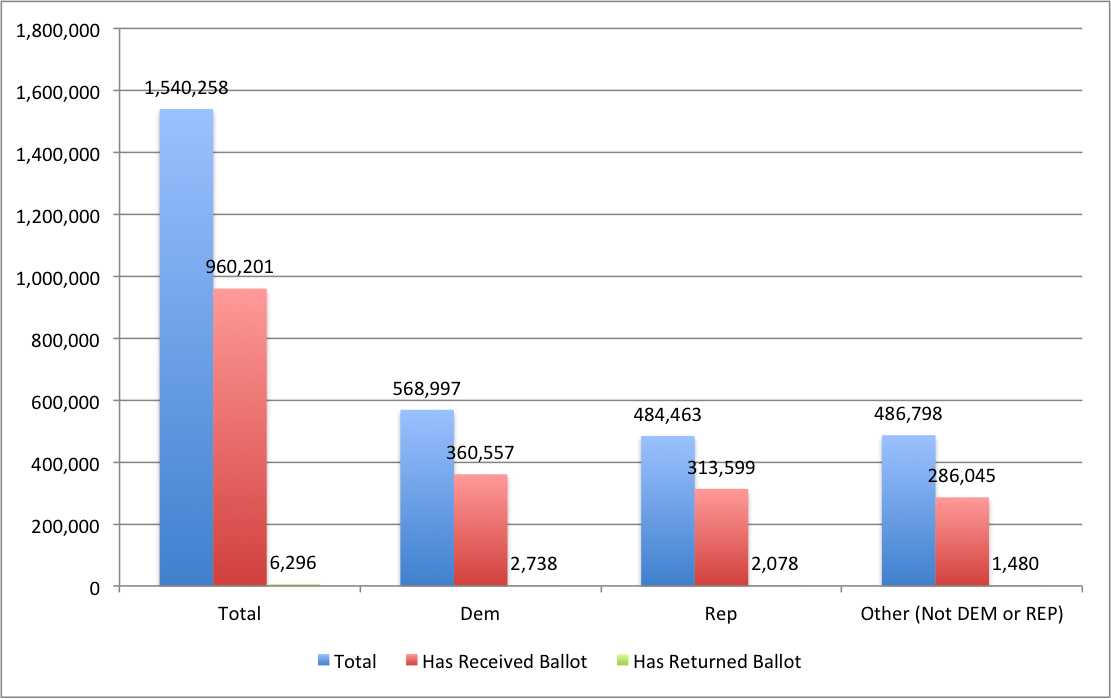
As of October 16, 2016 at 5:00pm, 960,201 ballots have been mailed to registered voters throughout the county .6,296 voters have voted (either by returning their ballot, or through early voting).
This equates to an overall voting rate of 0.66% among all ballots mailed.
Breaking down the ballots by party, total returns are comprised of 33.01% Republicans (1.55% above registration), 43.49% Democrats (6.55% above registration), and 23.51% independent (-8.10% below registration).
(Click to enlarge)
Click here for the excel breakdown.
Note: As we get more numbers, I will be doing breakdowns for County of San Diego, City of San Diego, and County Supervisor District 3.
If you have questions on any of these breakdowns, or would like a breakdown on a specific jurisdiction not listed, please e-mail me at mpherron@gmail.com.
Note: These returns are based on data provided by the Registrar of Voters to Political Data Inc. Accordingly, there is likely a delay of at least 1-2 days relative to the actual number of ballots returned.